
MindFusion.Reporting for Silverlight

MindFusion.Reporting for Silverlight 1.4

Silverlight reports, charts and relational data

MindFusion.Reporting for Silverlight is a developer component for adding reporting to Silverlight applications. It supports designing, displaying and printing reports and charts, as well as visualizing and editing relational data. The library can be integrated into software targeting Silverlight, making it suitable for applications that need embedded reporting and data views. It is distributed as a demo.

MindFusion.Reporting for Silverlight 1.4 details

Author:
License: Demo
Price: $300.00
Released:
File size: 8.30 MB
Downloads: 168
Keywords: silverlight report designer, data visualization, silverlight reporting component, Silverlight, component, interactive charts, printable reports component, report designing, software review, relational data visualization, silverlight reporting library, Silverlight component, report, MindFusion.Reporting, Silverlight application, report and chart library, Silverlight library, report design
Author URL: https://www.mindfusion.eu/
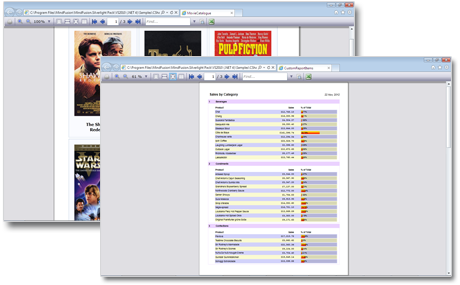
MindFusion.Reporting for Silverlight screenshot
MindFusion.Reporting for SilverlightComponents & LibrariesWindows XP, Windows Vista, Windows Vista x64, Windows 7, Windows 7 x64, Windows 8, Windows 8 x64, Windows 10, Windows 10 x64, Windows 11

User Rating: 0 (0 votes)

Windows 10

x32

Windows 10

x64

MindFusion.Reporting for Silverlight Awards

Windows 10 download editor's pick

MindFusion.Reporting for Silverlight for Windows 10 - Full description

MindFusion.Reporting for Silverlight is a reporting component for developers building applications on the Silverlight platform. It adds the ability to design, display and print reports and charts within a Silverlight application, and provides visual tools for working with relational data. It is intended for teams that need reporting features in an existing application without implementing every report and chart function themselves.

The component supports report design, allowing reports to be prepared for presenting application data. Its display capabilities let an application show report output to users, while print support provides a way to produce paper copies of that output. Charts can be used alongside reports to present data visually, helping applications communicate information in more than tabular form. The precise report layouts and chart contents depend on the application and the data it supplies.

MindFusion.Reporting for Silverlight also provides capabilities for visualizing and editing relational data. Developers can integrate these functions into software that works with related records, giving users a visual route to inspect or modify data rather than relying only on custom-built screens. As a reusable component, it can be incorporated into a Silverlight application's own interface and reporting workflow.

Typical uses include adding printable business reports, chart views or data-editing screens to Silverlight software. It can serve applications that need to present information to users as part of a larger product, rather than as a standalone reporting program. The component is aimed at developers integrating reporting into their software, not at end users seeking a separate report editor.

MindFusion.Reporting for Silverlight is distributed as a demo, so the demo license should be considered when evaluating it for a project. It targets applications built for Silverlight; the operating systems listed for the download include Windows 10 and Windows 11, as well as older Windows releases. Its relevance depends on a project's use of Silverlight and its development environment.

MindFusion.Reporting for Silverlight for Windows 10 - Post your review