Microsoft PIX
... our standout programs is Microsoft PIX, a powerful performance tuning and debugging tool designed specifically for game developers. Microsoft PIX allows developers to analyze the ...

JProfiler x64 helps Java developers investigate slow execution, memory use, leaks, and thread problems in JVM applications. It profiles local or remote sessions live, or collects data offline for later review. Memory views expose heap contents and allocation hot spots, while snapshots can be compared across runs. It also opens HPROF heap dumps and provides command-line and Ant tools for exporting data and reports.
| Author: | ej-technologies GmbH |
| License: | Trialware |
| Price: | $499.00 |
| Released: | May 22, 2024 |
| File size: | 107.00 MB |
| Downloads: | 467 |
| Keywords: | thread visualization, x64 Java profiler, x64 profile, x64 profile data, x64 heap walker, JProfiler x64, x64 Java, heap dump analyzer, ej-technologies GmbH, Java profiling, x64 profiler, java performance analysis, java thread profiling, memory leak detection, memory analysis, java profiler, performance tuning, java memory profiler |
| Author URL: | https://www.ej-technologies.com/ |

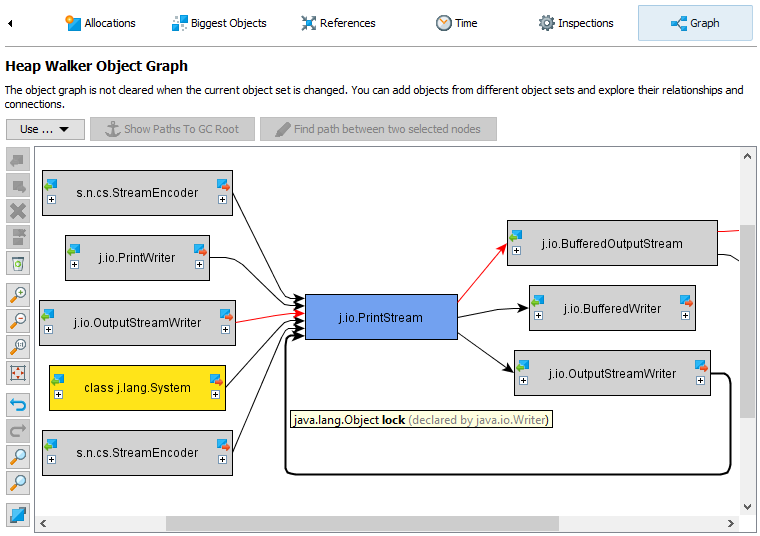

JProfiler x64 is a Java application profiler for developers investigating slow execution, excessive memory use, memory leaks, or thread-related problems. Its graphical interface connects to a running Java Virtual Machine (JVM) and presents profiling data in views that help trace resource use back to the code responsible. It supports local and remote profiling as well as offline collection, so teams can examine applications during development, in test environments, or on a separate server.
For live profiling, JProfiler starts an application with its profiling agent and displays updated data while the JVM runs. Memory views show objects on the heap by class or package, including instance counts and sizes; allocation views identify methods and call paths creating selected objects. Developers can use these views to locate allocation hot spots, compare current values with marked values, and inspect live or garbage-collected objects. CPU profiling helps identify time-consuming methods and call paths, while thread analysis supports investigation of thread activity and synchronization problems.
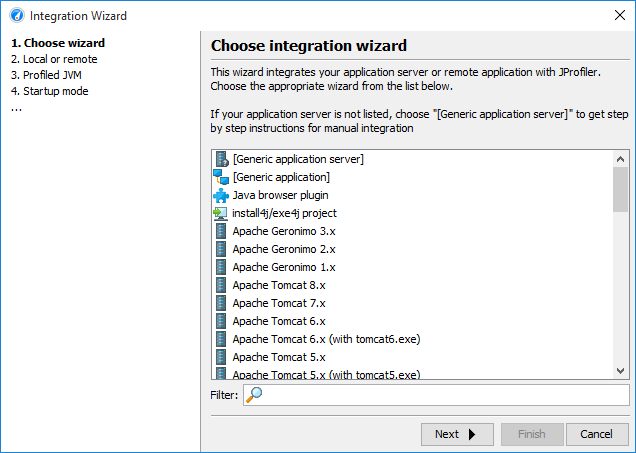
Remote profiling lets the application run on another machine and send data to the JProfiler interface over a network connection. JVM startup parameters configure the connection, and integration wizards help set up supported application servers. IDE integrations can launch profiling from a development workflow, avoiding the need to configure and start each session separately. These options make the same analysis tools useful for local testing and for reproducing performance issues in a deployment-like environment.
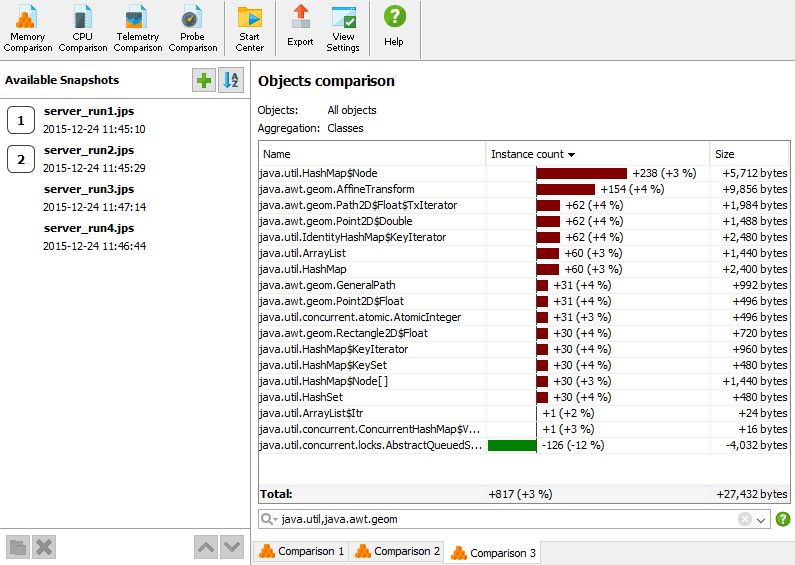
When continuous access to the interface is not practical, offline profiling can be controlled through triggers or the JProfiler API. The agent saves snapshots that can be opened later for inspection. Snapshots preserve profiling data for comparison across runs, helping developers check whether a code change altered memory use or other measured behavior. Command-line tools and Ant tasks can export profiling views or generate comparisons programmatically. JProfiler can also open HPROF heap snapshots produced by JVM tools such as jconsole and jmap, as well as dumps generated after an out-of-memory error.
JProfiler x64 is intended for Java developers and performance engineers who need to diagnose behavior in JVM applications. It is trialware and is offered here for 64-bit Windows systems, including Windows 10 and Windows 11. Remote, offline, and snapshot-based workflows allow analysis to fit different testing and operations setups, while the graphical views support interactive investigation of profiling data.