Jet Profiler for Windows 10 - Full description
Jet Profiler is a real-time performance and diagnostic tool for MySQL database servers. It helps database administrators and developers investigate workload patterns, find queries and tables associated with high activity, and identify possible bottlenecks. The profiler collects server activity without requiring changes to the MySQL server, making it useful for examining a running database while it handles normal workloads.
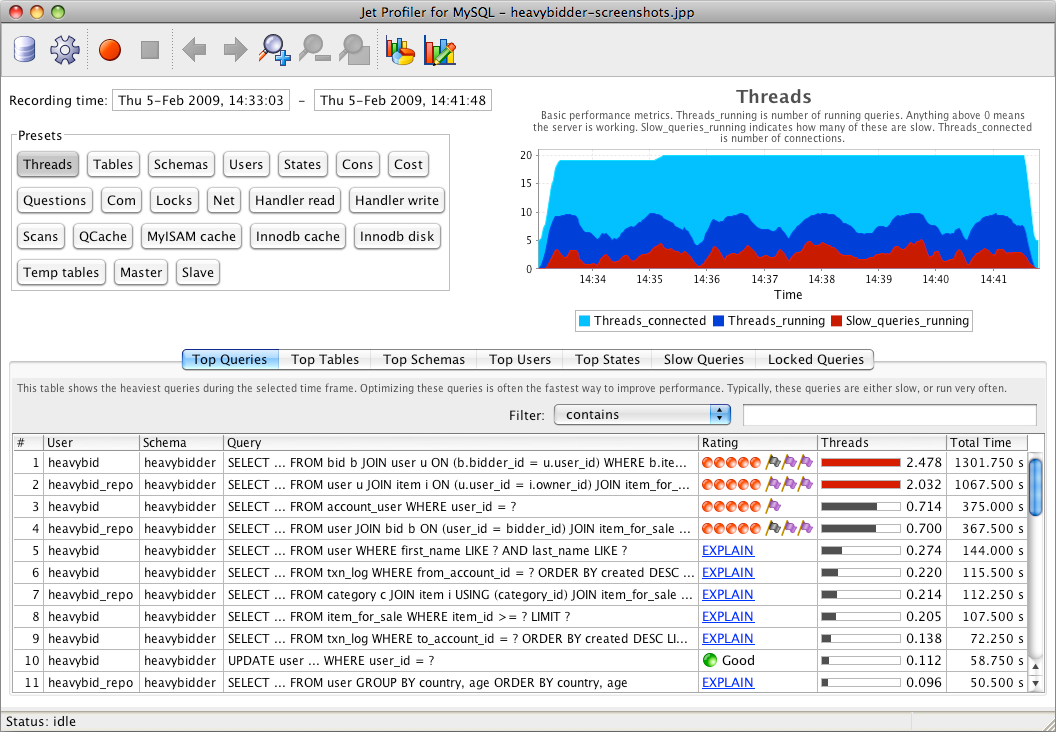
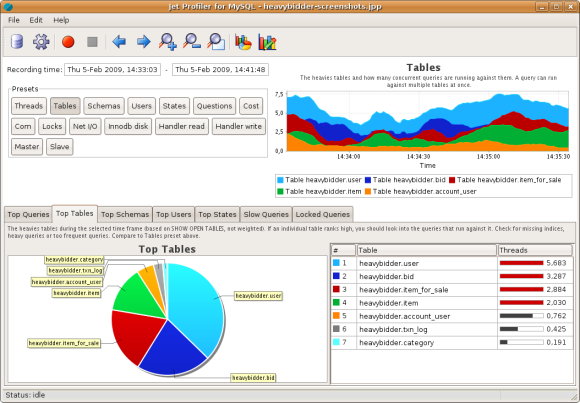
Its overview groups activity into top queries, users, tables, and server states. These views show which statements are run most often, which accounts generate the most activity, which tables are opened frequently, and what kinds of work occupy the server, such as creating temporary tables. Slow-query views rank queries by interval, while query ratings draw attention to statements that may create load because of factors such as missing indexes or large tables. Query execution plans can also be displayed as diagrams, showing table lookups, joins, and related ratings for closer inspection.
For replication environments, Jet Profiler reports master and slave thread activity and helps distinguish I/O pressure from SQL-thread bottlenecks. Replication profiling measures remaining capacity on the slave SQL thread, and lock analysis highlights MyISAM queries that contribute to contention or replication lag. General server metrics include connected threads, network I/O, command activity, and handler statistics. More than 50 metrics are recorded, providing context for query-level findings rather than leaving performance spikes unexplained.
A zoomable timeline lets users focus on a period of unusually high load and inspect the queries recorded during that interval. Recording granularity can be adjusted, and profiling data can be saved and loaded for later analysis. This supports comparisons between different time periods, such as a typical week and a high-load period, and gives teams a way to retain observations while investigating intermittent problems. The tool is designed for relatively low monitoring overhead, typically around one percent of the database's capacity according to its stated operating profile.
Jet Profiler is suited to diagnosing busy MySQL installations, reviewing slow or frequently executed statements, investigating replication delays, and checking whether table locks or server resources are limiting throughput. It is offered as demo software and is available for Windows, Linux, and Mac. The Windows operating systems named for the software range through Windows 10; compatibility with later Windows releases should be checked before installation. Its setup is intended to work without server-side changes.