Adobe Flash Player Debugger
Adobe Flash Player Debugger is a development utility for working with Adobe ... player intended mainly for viewing Flash content, the debugger is aimed at development and troubleshooting workflows. During a ...

OllyDbg is a 32-bit assembler-level debugger for Windows, useful for examining applications when source code is unavailable. It analyzes binary code, identifies procedures, loops, API calls, tables and strings, and lets users trace execution, inspect registers and examine memory. Breakpoints, DLL debugging, patch support, labels and comments assist detailed investigations. The freeware runs without a conventional installation.
| Author: | Oleh Yuschuk |
| License: | Freeware |
| Price: | FREE |
| Released: | Oct 1, 2013 |
| File size: | 6.60 MB |
| Downloads: | 3024 |
| Keywords: | binary code analysis, debug, assembly level analysis, OllyDbg, windows assembler debugger, ollydbg debugger, x64 software, debugger, 32-bit disassembler, API debugger, api debugging tool, debug application, debug executable files, Windows 10, debugging tool, assembler, Oleh Yuschuk, code analysis |
| Author URL: | https://www.ollydbg.de |

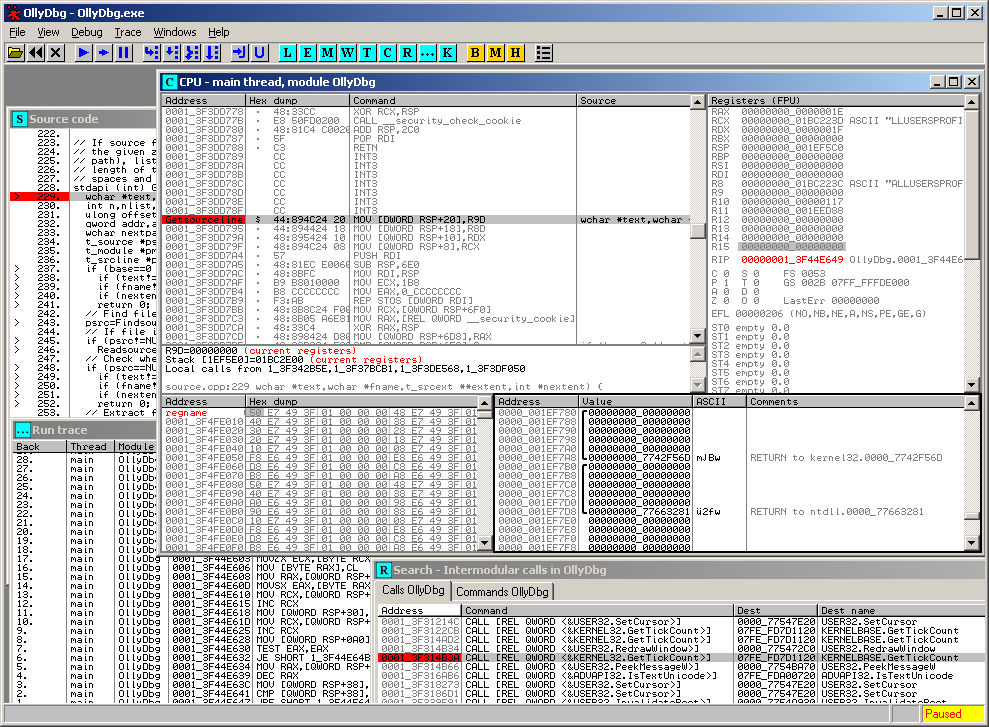


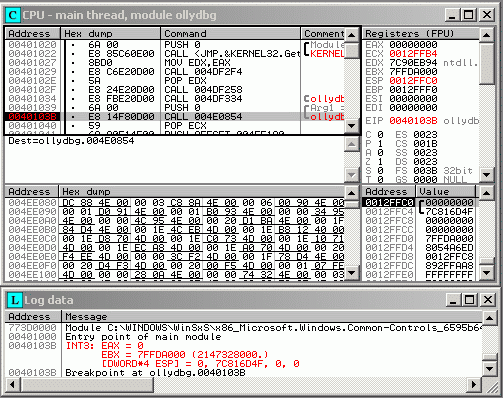

OllyDbg is a 32-bit assembler-level debugger for Microsoft Windows, intended for developers and analysts who need to inspect how a program behaves at the machine-code level. It is especially useful when source code is unavailable: instead of relying on a project's original files, users can follow instructions, inspect memory and examine the program while it runs. Its graphical interface presents disassembly and debugging information without requiring command-only interaction.
The disassembler helps make low-level code easier to investigate by identifying procedures, loops, API calls, switches, tables, constants and strings. It can recognize ASCII and Unicode strings, including Delphi-formatted strings, and decode calls to a large set of standard Windows API and C functions. Users can follow program execution, view register and stack-frame changes, and log arguments passed to recognized functions. Context-sensitive API help can be connected through an external help file.
OllyDbg supports debugging both multithreaded applications and running programs attached after launch. Conditional, logging, memory and hardware breakpoints let users pause execution at particular events or record activity without stopping at every instruction. During a session, memory can be examined and modified, references to constants or address ranges can be searched, and allocated memory can be scanned for binary sequences. The debugger can also load DLLs directly and locate routines in object files and libraries.
For ongoing analysis, users can add labels, comments and function descriptions, then save patches between sessions and write them back to an executable while updating fixups. The disassembler can be configured for MASM or IDEAL syntax, and the program includes support for debugging information in Borland format and instructions or data types associated with MMX, 3DNow! and SSE. Its open architecture allows third-party plugins to add tools and workflows.
OllyDbg is freeware and runs without a conventional installation, avoiding changes to registry settings and system directories. The supplied compatibility information includes Windows 10, including 64-bit Windows 10; it does not establish compatibility with Windows 11. As a 32-bit debugger, it is suited to examining 32-bit applications rather than serving as a general-purpose debugger for every Windows program. Its features are aimed at hands-on binary analysis, software debugging and investigating executable behavior.