Cok Auto Recorder
... Recorder" developed by the renowned Cok Software. This Windows 10 compatible software is a game-changer in the world of automatic recording. Cok Auto Recorder is ...

Sonic Visualiser is an open-source audio analysis application for musicians, researchers and audio engineers. It displays recordings as waveforms and spectrograms, helping users inspect changes in level and frequency over time. Annotations mark points or sections for later reference, while plugins add tools such as pitch detection, beat tracking and harmonic analysis. Playback can be slowed or adjusted in pitch to make detailed listening and transcription easier.
| Author: | Chris Cannam |
| License: | Open Source |
| Price: | FREE |
| Released: | Mar 7, 2025 |
| File size: | 21.60 MB |
| Downloads: | 379 |
| Keywords: | waveform, audio analysis, Windows 10 compatible, audio spectrogram viewer, pitch and beat analysis, personalizer, audio visualization, spectrum, waveform analysis tool, audio analysis software, Chris Cannam, Sonic Visualiser, music visualization, open-source software, audio annotation software, music transcription tool, audio analyzer |
| Author URL: | https://www.sonicvisualiser.org/ |

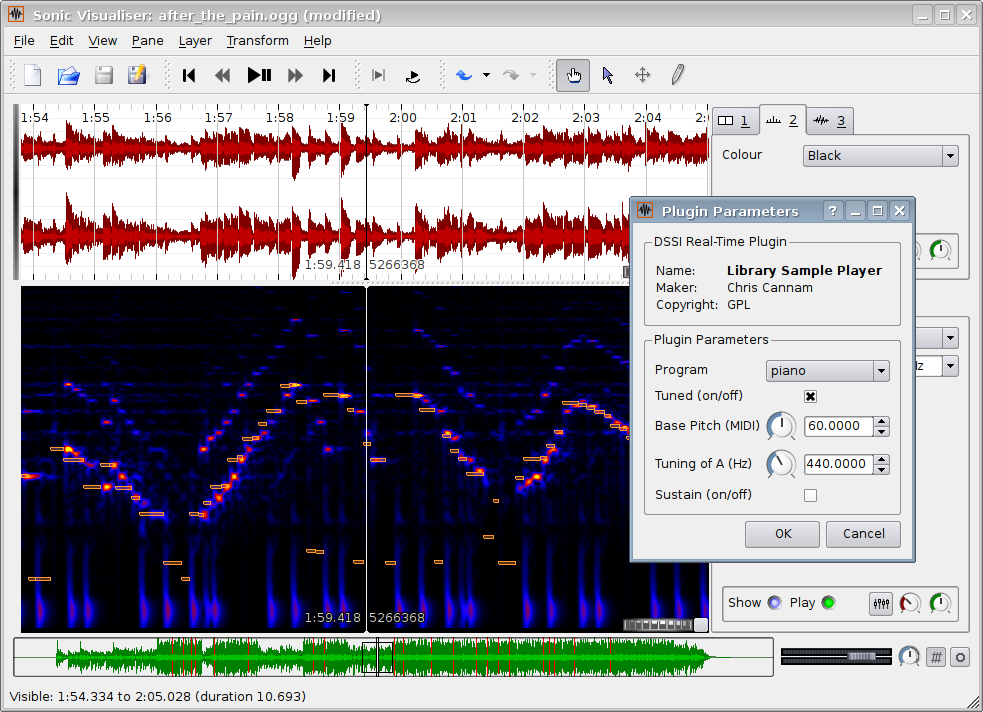





Sonic Visualiser is an open-source application for inspecting and visualising audio files. It is intended for musicians, music researchers, audio engineers and others who need to study how sound changes over time rather than simply play a recording. Its layered views help connect what is heard with measurable features in the audio, making it useful for close listening, transcription and research.
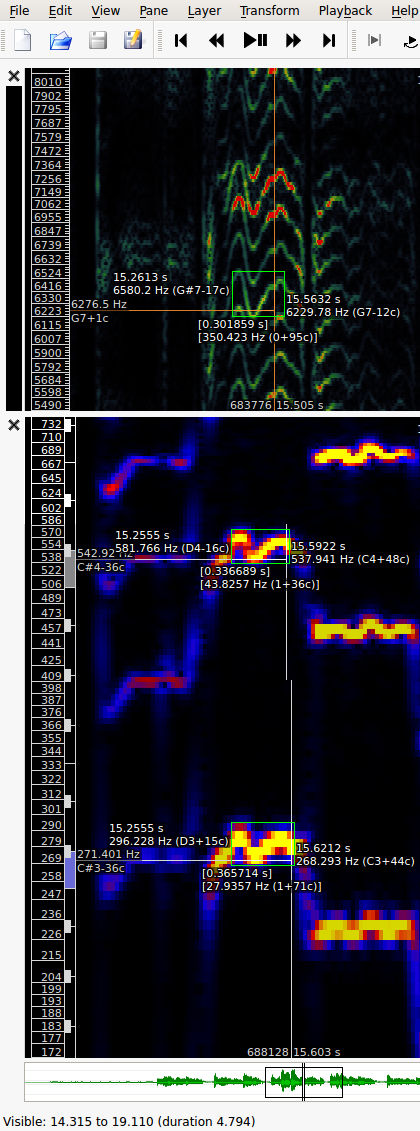
After loading a recording, users can inspect its waveform to see changes in signal level and navigate to particular moments. A spectrogram represents frequency content across time, helping reveal notes, harmonics, transients and other details that may be difficult to distinguish by ear. Different visual representations can be used to examine the same passage from different angles. The display and playback work together, so a selected region can be heard while its structure is viewed, supporting focused analysis of a phrase or event.
Annotations let users mark specific points or sections with labels and comments. These notes can document observations, identify musical events or keep track of questions for later review. This is useful in musicology and audio engineering workflows where findings need to be associated with exact positions in a recording. Sonic Visualiser also supports plugins that add analysis functions, including pitch detection, beat tracking and harmonic analysis. The plugin architecture allows the tool to be extended for different analytical needs, rather than limiting work to its built-in visual displays.
Playback controls include time-stretching and pitch-shifting. Slowing a passage can make a fast performance easier to follow for transcription or practice, while changing playback speed without changing pitch preserves the notes' perceived register. Conversely, pitch can be adjusted without changing tempo. These functions allow users to investigate difficult passages and compare musical details at a more convenient speed or pitch, while keeping the original audio available for reference.
Sonic Visualiser is free and open source, and runs on Windows 10 and Windows 11 in 32-bit and 64-bit environments. It suits tasks such as studying a musical performance, annotating recordings for research, examining sound frequencies and following rhythm or pitch with suitable plugins. Its purpose is detailed audio analysis, so it complements rather than replaces a conventional audio player or a full editing workstation. The combination of visual inspection, playback and annotation gives users a practical way to relate observations to precise moments in a recording.