Mp3tag
... software developed by the ingenious Florian Heidenreich. This Windows 10 compatible software is a powerful and easy-to-use tool to edit metadata of audio files. It ...

RealView records values from analogue hardware devices and plots them in real time. It supports sampling intervals from 5 milliseconds to 30 minutes, multiple curves per diagram, and separate or shared Y-axes. Users can arrange plotters across pages, customize curve and background styling, zoom into recorded data, and use markers to inspect differences, amplitude or period. Diagrams can be annotated in print preview, and measurement data can be exported for use in applications such as Excel.
| Author: | ABACOM |
| License: | Demo |
| Price: | $49.90 |
| Released: | Jan 28, 2011 |
| File size: | 3.50 MB |
| Downloads: | 301 |
| Keywords: | measurement plotter, record data, signal curve analysis, real-time measurement software, analogue data logger, plot measured data, Windows 10 compatible, hardware debugging tool, measure, microcontroller programming, record, x64 software, plot data, measurement, ABACOM RealView, electronic circuit simulation, export measurement data, data measurement |
| Author URL: | http://www.abacom-online.de/ |

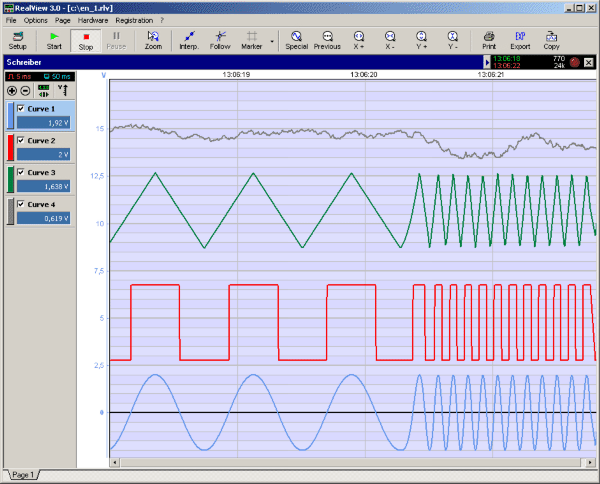
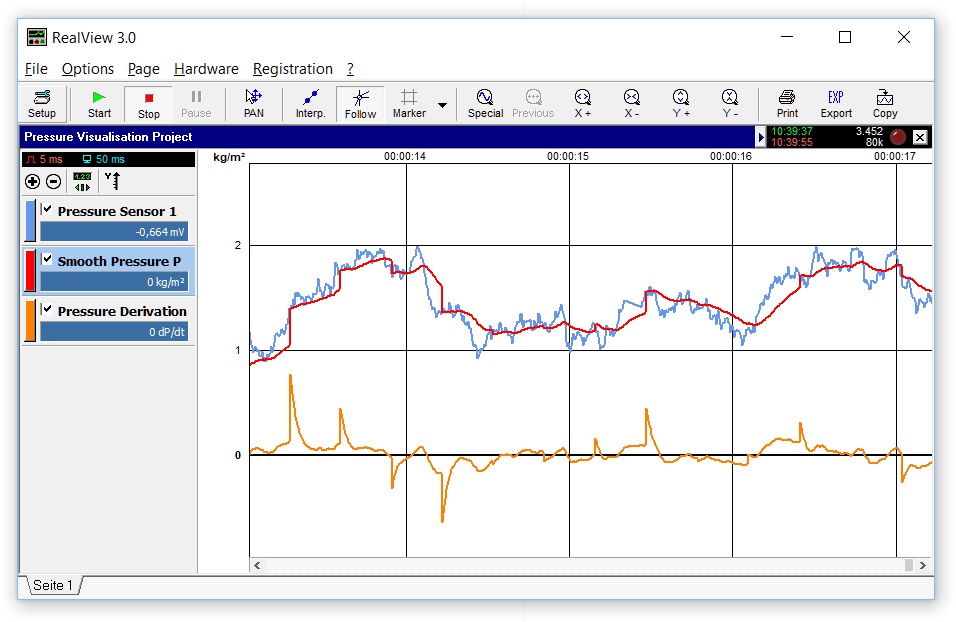

RealView is a measurement and plotting application for recording values from analogue hardware devices in real time. It is intended for users who need to monitor measured signals, compare several readings and review results in diagrams. The sampling interval can be set from 5 milliseconds to 30 minutes, allowing the application to handle both rapidly changing signals and measurements taken over longer periods. Recording duration is not limited by a fixed time window.
Several curves can share a single diagram, making it possible to compare related measurements at a glance. Each curve can use its own Y-axis, or multiple curves can share one axis when their values are directly comparable. Multiple plotters can be placed side by side, stacked vertically or organized across separate pages, so a project can present several signals without crowding them into one view. Users can adjust pen color and width, plotter background and other design settings to distinguish curves and create a readable layout.
After recording, zoom controls help examine a particular region of a curve or return to a broader overview. Markers support closer analysis by making it easier to read differences between points and determine signal amplitude or period. These tools are useful when a measurement needs more than a visual overview and specific values or intervals need to be inspected.
RealView also supports preparing diagrams for sharing and further work. Its print preview allows comments and project information to be added before printing, while data export makes measured values available to other applications, including spreadsheet software such as Microsoft Excel. This lets users move from live acquisition to analysis, documentation and reporting within a practical measurement workflow.
The software is offered as a demo and is designed for Windows. It is suited to measurement tasks involving analogue hardware, from observing signal behavior to arranging and exporting recorded results. The device provides the measured values; RealView records and plots them, with sampling settings and diagram layouts available to match the requirements of a particular measurement.