Ahnenblatt
... software developed by the ingenious Dirk Böttcher. This Windows 10 compatible software is a genealogist's dream come true, offering a comprehensive platform to manage, organize, ...

Panoply is a scientific data viewer for exploring and plotting multidimensional datasets in netCDF, HDF and GRIB files. It creates latitude-longitude maps, zonal averages, time series and scatter plots, with options to adjust color scales and overlay datasets. A built-in browser helps locate variables, while animation and plot export support further analysis and presentation.
| Author: | Robert B. Schmunk |
| License: | Freeware |
| Price: | FREE |
| Released: | Oct 2, 2026 |
| File size: | 53.50 MB |
| Downloads: | 595 |
| Keywords: | data visualization software, plot raster image, climate data maps, Panoply software, longitude image, panoply data viewer, hdf file viewer, scientific data plotting, pole-to-pole image, NASA tool, rasterize, Robert B. Schmunk, raster image, netcdf visualization, grib data viewer, Windows 10 compatible, raster, x64 application |
| Author URL: | https://www.giss.nasa.gov/ |
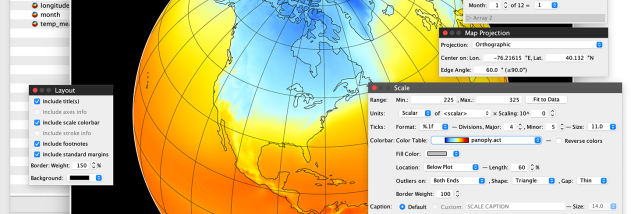




Panoply is a scientific data viewer and plotting application for researchers and other users working with multidimensional datasets. It reads common scientific file formats, including netCDF, HDF and GRIB, and turns variables in those files into maps and graphs. This makes it useful in fields such as climate science, meteorology and oceanography, where measurements often span multiple locations, depths or times.
The application can plot data as latitude-longitude maps, zonal averages, time series and scatter plots. A map can show how a selected variable is distributed geographically, while a time series helps trace changes over time. Zonal averages summarize values across longitude or latitude bands, and scatter plots make it possible to compare variables. Plot options such as color scales help tailor the display to the data being examined.
A built-in data browser helps users inspect a file and choose its variables for plotting, which is useful when datasets contain many fields. Panoply can also overlay datasets in a plot, allowing related information to be viewed together, and export plots for use in reports or other workflows. Animation support can show how data changes over time, making temporal patterns easier to follow than in a single static image.
Panoply is intended for visual exploration and presentation of scientific data rather than as a general-purpose spreadsheet or full data-processing environment. Typical uses include examining climate grids, comparing geospatial measurements, viewing atmospheric or oceanographic fields, and preparing figures from multidimensional files. The range of plot types lets users choose a view suited to the shape and purpose of their data.
The software is freeware and is available for Windows, macOS and Linux. On Windows, it supports 64-bit editions of Windows 10 and Windows 11, as well as several Windows Server releases. It provides a desktop interface for browsing datasets and producing visualizations, making it accessible to users who need to inspect scientific file contents without writing a plotting script.