KaPiGraf
... for all Windows 10 users who deal with data analysis and presentation. KaPiGraf is a unique software that ... data from Excel and instantly generate an interactive graph. This graph not only represents your data visually ...

ProsimGraphsPro is graphing and analysis software for chemical engineers, researchers and educators. It creates line graphs, scatter plots, bar charts and other charts from imported spreadsheet or database data. Users can customize labels, scales, colors and legends, and apply regression analysis, curve fitting and statistical tools to explore datasets and prepare technical figures.
| Author: | ChemEng Software Design |
| License: | Trialware |
| Price: | FREE |
| Released: | Sep 23, 2024 |
| File size: | 13.20 MB |
| Downloads: | 352 |
| Keywords: | data analysis, chemistry, unit conversion, create graph, creator, data visualization tool, ProsimGraphsPro, graph, regression analysis tool, scientific graphing software, chemical engineering graphing, chemistry graph, curve fitting software, spreadsheet graph maker, scientific graphing, Windows 10 compatibility, x64 software, ChemEng Software Design |
| Author URL: | https://www.cesd.com/ |


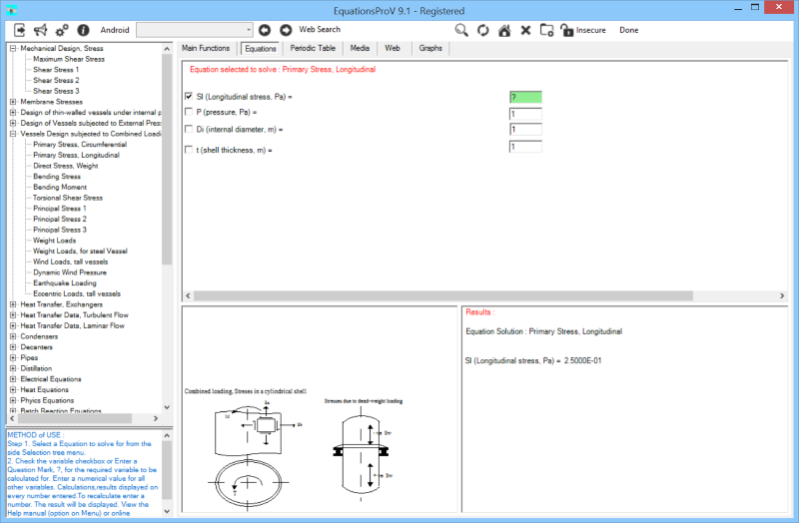



ProsimGraphsPro is graphing and data-analysis software from ChemEng Software Design for chemical engineers, researchers, educators and others who need to turn numerical data into visual results. It brings chart creation and several analysis tools together, so users can inspect data and prepare graphs without switching between separate applications. The software is intended for work with technical and scientific information, where choosing a suitable graph and clearly presenting its values can help reveal patterns and support comparison.
The program creates line graphs, scatter plots, bar charts and other graph types. Users can select a format suited to the data, then adjust graph elements such as axis labels, scales, colors and legends. These settings help distinguish data series, clarify units and make charts easier to interpret in reports, presentations or teaching materials. Data can be imported from spreadsheets and databases, providing a route from existing records to a plotted result rather than requiring every value to be entered again.
ProsimGraphsPro also includes regression analysis, curve fitting and statistical analysis. These tools let users examine relationships between values and assess how a curve or statistical treatment represents a dataset, while keeping the resulting analysis close to its graph. This can be useful when evaluating experimental results, reviewing process measurements or illustrating calculated trends. Handling graph configuration and analysis within one application can simplify routine work with technical datasets.
Typical uses include plotting measurements from chemical engineering experiments, comparing process data, preparing figures for research or instruction, and presenting numerical findings to colleagues. The range of chart styles supports different kinds of comparisons, while the formatting controls help adapt a graph to its intended audience. Engineers may use it to review data, researchers to communicate results, and educators to demonstrate trends or relationships in class materials.
ProsimGraphsPro is trialware and is available for Windows 10 and Windows 11, as well as older Windows releases. Its graphing and analysis features are suited to users who need more than a basic charting tool, particularly in technical or educational settings. The included documentation and support resources can help users learn the workflow and make use of its graph and analysis options. Users should check the trial terms and system requirements before installation.