Sysinternals Suite
Sysinternals Suite is a collection of Windows utilities for IT professionals, developers and advanced users who need to inspect, troubleshoot or manage system activity. Rather ...

VMMap is a process virtual and physical memory analysis utility for developers investigating application memory use. It breaks down committed virtual memory by type and shows the physical memory assigned to those types in a process's working set. Graphs, summaries and a detailed memory map help locate usage, while filtering and refresh controls support live analysis. Data can be exported, saved in VMMap's native format for later review, or examined through command-line workflows.
| Author: | Alexander Bagel |
| License: | Open Source |
| Price: | FREE |
| Released: | Oct 23, 2026 |
| File size: | 8.40 MB |
| Downloads: | 378 |
| Keywords: | analyzer, Windows 10 software, process memory map, application memory profiling, working set monitor, Mark Russinovich, memory analysis, process memory analyzer, analyze, Bryce Cogswell, analysis tool, VMMap, physical memory analysis, memory usage breakdown, Sysinternals Suite, analysis, virtual memory analysis, memory usage |
| Author URL: | https://github.com/AlexanderBagel/ProcessMemoryMap |
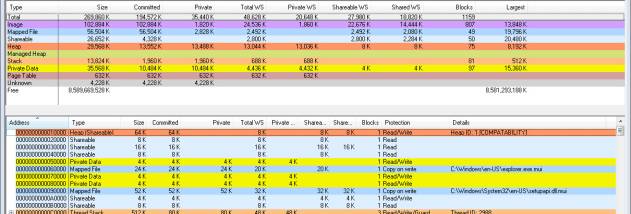
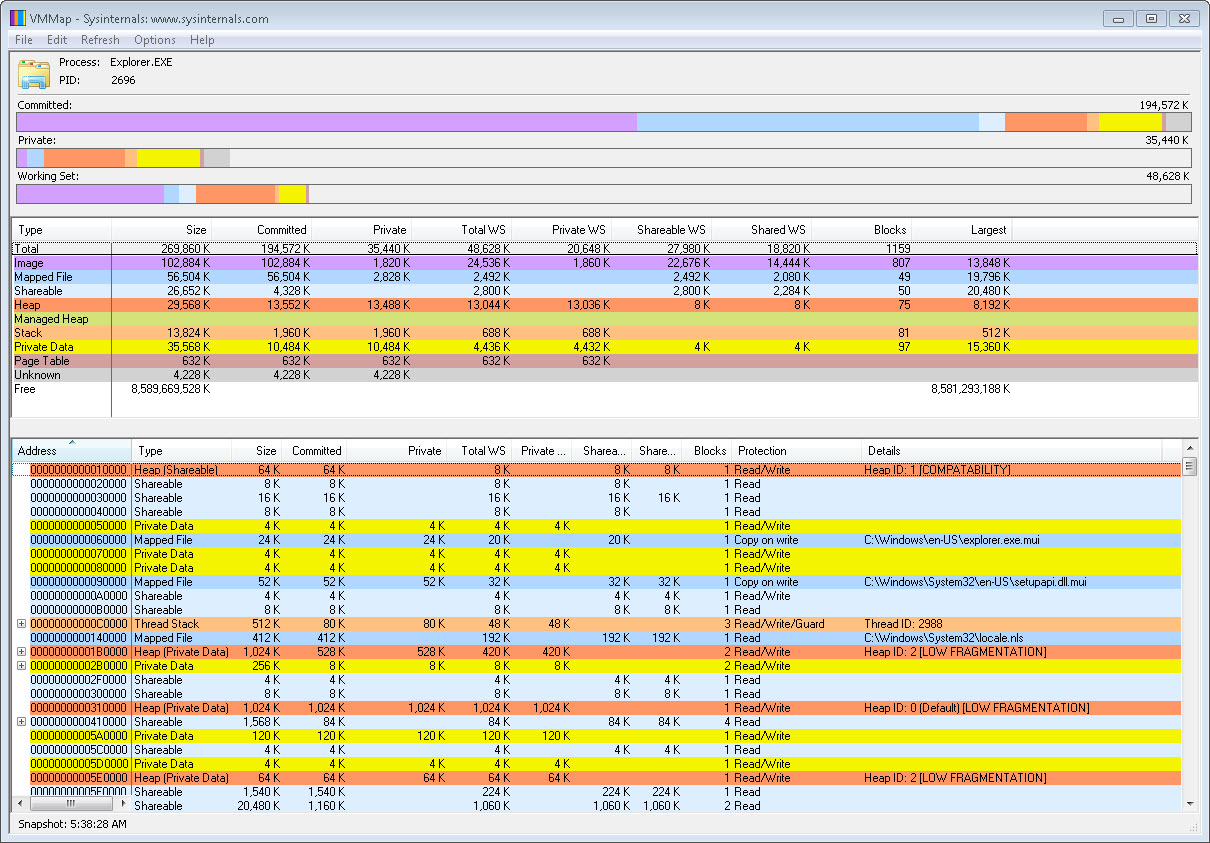





VMMap is a process memory analysis utility for developers investigating how an application uses memory. It examines both virtual memory and physical memory, helping explain what a process has committed and how much of its working set is currently assigned by Windows. This makes it useful when diagnosing unexpectedly high memory use, comparing application features, or looking for opportunities to reduce an application's memory cost.
The utility breaks down committed virtual memory by type and shows the physical memory associated with those types. Graphical views make the overall distribution easier to scan, while summary information provides a compact account of the process's memory use. A detailed process memory map offers a more granular view for examining where memory is allocated. Together, these views help developers move from a broad observation, such as a large working set, to a more specific investigation of its sources.
VMMap can analyze live processes, and its filtering and refresh capabilities support focused, ongoing inspection. Filtering helps narrow the displayed information to relevant memory categories or regions; refreshing updates the view as process memory changes. Data can also be exported in multiple forms. Its native format preserves the full analysis for loading again later, which is useful for retaining a snapshot, reviewing results after an investigation, or sharing a detailed record. Command-line options allow analysis to be incorporated into scripts and repeatable workflows.
Typical uses include investigating memory growth, checking the resource impact of application features, and comparing process memory behavior during development or testing. Developers can use the breakdown to identify which kinds of memory account for a process's committed space and working set, then repeat the analysis after changes to assess their effect. The combination of live inspection, saved data, and command-line operation suits both interactive troubleshooting and automated analysis.
VMMap is freeware and is available for Windows 10 and Windows 11, as well as several earlier Windows releases. It is intended for examining individual processes rather than providing a general-purpose system cleanup or memory optimization function. Its role is to show memory usage and preserve analysis data so developers can investigate and optimize their own applications.