Portable MicroDicom x64
Portable MicroDicom x64 is a freeware viewer and basic ... review imaging studies on a Windows computer. Its portable form is useful when images need to be ...

Gnuplot is a portable, command-line graphing utility for plotting mathematical functions and data. It creates 2D and 3D graphs using lines, points, boxes, contours, vector fields, and surfaces. Users can work interactively or run scripts to regenerate plots and automate output. Graphs can be displayed in interactive windows or exported to formats including PDF, PNG, SVG, PostScript, and JPEG. It is also used as a plotting engine by applications such as Octave.
| Author: | Philipp K. Janert |
| License: | Open Source |
| Price: | FREE |
| Released: | May 29, 2019 |
| File size: | 27.50 MB |
| Downloads: | 319 |
| Keywords: | plotter, graph, Command-line driven utility, graph plotter, Gnu plot, 3d function plotter, portable, plot graph, 2d graph plotting software, Gnuplot, Philipp K. Janert software, Windows data plotting, plot data from scripts, Interactive plotting program, utility, gnuplot graphing utility, scientific graphing tool, gnuplot for windows, Scientific graphics, Gnuplot visualization |
| Author URL: | http://www.gnuplot.info/ |
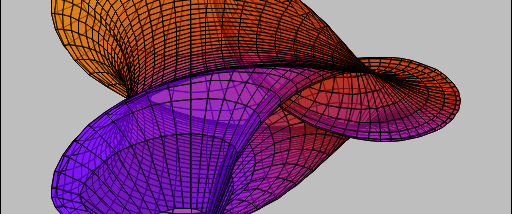

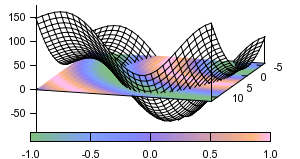
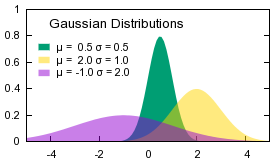


Gnuplot is a portable, command-line graphing utility for scientists, students, engineers, and anyone who needs to visualize mathematical functions or data. It can be used interactively by entering commands or non-interactively by running scripts, making it suitable for both exploratory plotting and repeatable chart generation. Gnuplot can also serve as the plotting engine inside other applications, including Octave, or be incorporated into web workflows.
The program creates two-dimensional and three-dimensional plots from functions and data. In 2D, it can draw lines, points, boxes, contours, and vector fields; in 3D, it can render surfaces and other plot types. Users control the plot through commands that specify data sources, axes, labels, and drawing styles. The same plotting approach can be applied to different kinds of input, helping users compare results or adjust a graph without recreating it manually in a drawing tool.
Gnuplot can display graphs in interactive windows and export them as files for use elsewhere. Its output options include formats such as PostScript and EPS, PDF, PNG, GIF, JPEG, SVG, EMF, and LaTeX-related formats. It also supports mouse-interactive web displays in HTML5 and SVG. This range lets a user inspect a graph on screen, include a static image in a report, or generate an output suited to a publication or web page. Available display and output options depend on the installed build and environment.
Script-driven operation is useful when plots need to be regenerated from changing data, produced in batches, or embedded in a larger process. Gnuplot includes a collection of scripted examples that can help users learn its commands and adapt common plotting patterns. Its command-line workflow also makes it practical as a component in scientific computing and data-processing pipelines, while interactive input supports quick tests of a function or dataset.
Gnuplot is open-source software distributed without a purchase cost. It runs on Windows and on several other operating systems, and its portable design supports use across different environments. The Windows package is intended for desktop use; Gnuplot's command-oriented interface is central to its workflow, so it is best suited to users comfortable entering commands or editing scripts. It has a long history of use in scientific and educational visualization.