SMART Disk Monitor
SMART Disk Monitor is a disk-space monitoring tool for network administrators who need to track storage ... locations, or manage multiple disks as a group. SMART Disk Monitor is trialware from Corner Bowl Software. Its stated ...

PerfMonitor is a CPUID utility for tracking processor events and hardware readings. It displays up to four selected counters as graphs and can show values at the processor, core, or logical CPU level. Available measurements depend on the processor and may include CPU activity, cache misses, mispredicted branches, temperatures, and power. It is useful for investigating performance bottlenecks or comparing CPUs under the same benchmark.
| Author: | CPUID |
| License: | Freeware |
| Price: | FREE |
| Released: | Dec 26, 2014 |
| File size: | 922 kB |
| Downloads: | 355 |
| Keywords: | cpu temperature monitor, Perf Monitor, Disk monitor, Monitoring tool, real-time CPU tracking, Processor monitor, system optimization software, processor monitoring tool, processor benchmark comparison, Windows 10 compatibility, cpu counter graphs, Monitoring software, CPUID PerfMonitor, CPU Monitoring, cpu performance monitor, Network monitor, x64 software, cache miss monitor, performance monitoring tool, CPU monitor, Performance monitor |
| Author URL: | https://www.cpuid.com/ |
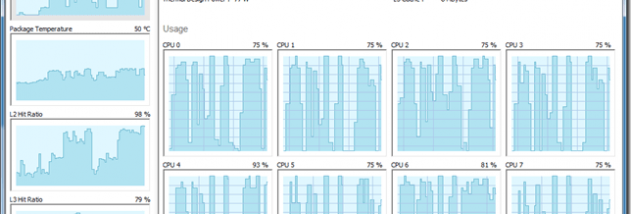

PerfMonitor is a processor monitoring utility from CPUID for users who want to examine CPU activity and hardware performance. It tracks processor-related events and presents their values in graphs, making it useful for checking how a system behaves under load, investigating bottlenecks, or comparing processors during the same benchmark. The available measurements depend on the processor model, so the tool's counter choices are tailored to the hardware being monitored.
The interface has a counter-selection view with four graph slots. Each slot can be assigned a supported counter, allowing users to watch up to four measurements at once. The CPU counter view displays the selected values at the processor, core, or logical CPU level, depending on the type of event, alongside basic processor information. If a computer has multiple processors, the selection menu lets users choose which one to monitor.
Performance counters can report details such as CPU activity, cache misses, and mispredicted branches. These measurements help identify where a workload may be spending time or encountering inefficiencies. The program also provides hardware readings such as temperatures and power, where supported. Because the available events and the number of counters vary by processor family, some measurements appear only in particular counter configurations. Switching configurations lets users access different groups of events; only a limited number of processor performance events can generally be monitored at the same time.
PerfMonitor can support several kinds of analysis, from observing processor behavior while an application runs to comparing CPU performance under a shared benchmark. Graphs offer a direct way to follow changes over time, while the level-specific readings help distinguish activity across the processor, its cores, and logical CPUs. The interface is intended to make counter selection approachable, although familiarity with basic processor terminology can help users interpret less common measurements.
PerfMonitor is freeware. The supplied operating-system information includes Windows 10, as well as older Windows releases; it does not establish Windows 11 compatibility. Counter availability depends on the installed processor, and the program is most useful when its measurements are selected with a particular troubleshooting or comparison question in mind.